Understanding Color Interpolation
Download PDF - Color-Interpolation
Preparing for use
Before you use your camera, we recommend that you are aware of the following resources available from our downloads page:
- Getting Started Manual for the camera—provides information on installing components and software needed to run the camera.
- Technical Reference for the camera—provides information on the camera’s specifications, features and operations, as well as imaging and acquisition controls.
- Firmware updates—ensure you are using the most up-to-date firmware for the camera to take advantage of improvements and fixes.
- Tech Insights—Subscribe to our monthly email updates containing information on new knowledge base articles, new firmware and software releases, and Product Change Notices (PCN).
Color imaging
There are many ways to capture a color image. Some examples include:
- Prism splitting light onto three sensors
- Variable wavelength penetration depth sensors
- Color filter tile array interpolation
Most of today’s digital color imaging is done using a color filter array (CFA) placed in front of a CCD or CMOS sensor. A CFA typically has one color filter element for each sensor pixel. Each filter element acts as a bandpass filter to incoming light and passes a different band of the electromagnetic spectrum. Typical filter arrays tend to isolate red, green, and blue bands of the visible light spectrum. Once each color is isolated, the missing colors on adjacent pixels are interpolated by an algorithm to reconstruct a full color image. This is the basis of modern color imaging.
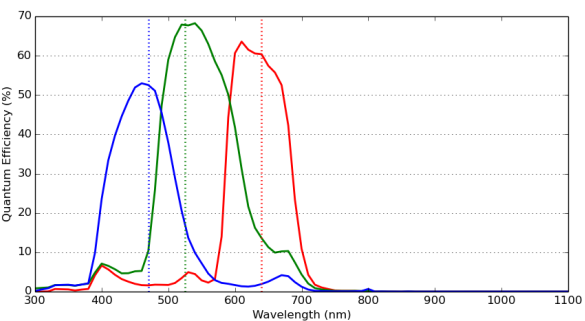
Sensor response curve for BFS-U3-51S5C
Bayer tile pattern
The filter elements on a CFA consist of several different band-pass filters placed on top of each pixel by the sensor manufacturer. The figure above shows an example of the bandpass filter response curve for Red, Green, and Blue tiles, the typical CFA tiles. These tiles are commonly arranged in a Bayer tile pattern. This tile pattern closely matches human visual system luminance. Specifically, the peak sensitivity of human visual systems is green detail and the Bayer tile pattern has more green tiles than blue or red tiles. There are a variety of Bayer tile pattern types. Below is one example of one possible combination [R1,G2;G7,B8]. There are three other possible combinations: [G7, B8; R12, G13], [G2,R3;B8,G8], [B8,G8;G13,R14].
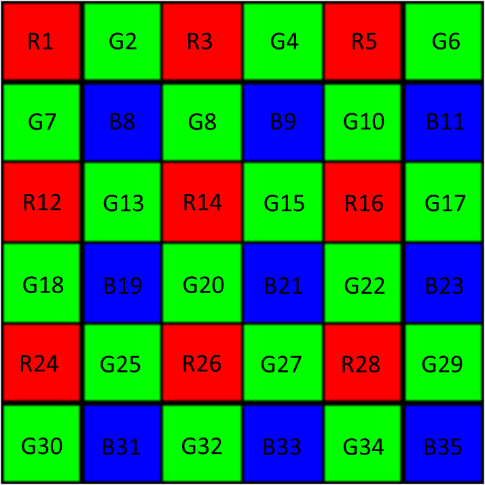

Bayer tile filter on Sony IMX sensors
The tile pattern above is just an example of what can be found on a sensor. To determine the exact tile pattern on your camera:
Using GenICam (SpinView)
- Open SpinView.
- On the feature tree, under Image Format Control, select a Bayer pixel format (for example, BayerRG8).
The Pixel Color Filter displays the filter used (in this example, BayerRG or RGGB).


Using IIDC CSRs (FlyCap)
- Open FlyCap.
- On the Camera Registers tab, in the Register field, enter 1040 and click Read Register.
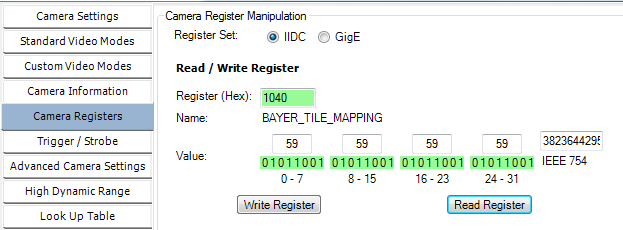

This 32-bit read-only register 1040h specifies the sequence of the camera's Bayer tiling. The ASCII representation of the color's first letter indicates the tile pattern as below:
| Color | ASCII |
|---|---|
| Red (R) | 52h |
| Green (G) | 47h |
| Blue (B) | 42h |
| Monochrome (Y) | 59h |
For example, 0x52474742 is RGGB and 0x59595959 is YYYY.
Note: Because color models support onboard color processing, the camera reports YYYY tiling when operating in any non-raw Bayer data format.
When viewing raw Bayer images, you can see the Bayer tile pattern over the image.
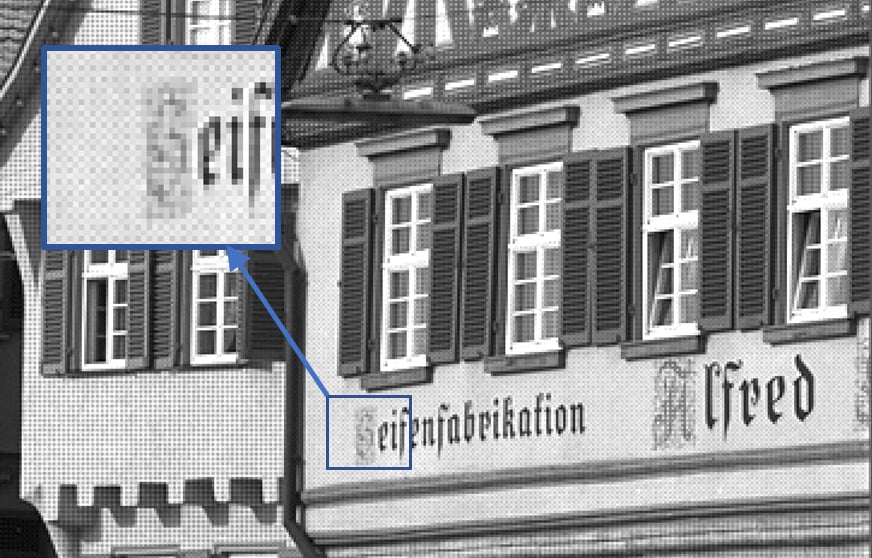

Raw image with no color interpolation applied. One can clearly see the tile pattern in the insert.
Interpolation
The mechanics of how interpolation is performed are usually trade secrets if they are not publicly available. Generally, converting a CFA image into a three color channel image requires using neighboring pixels to interpret the missing color channels for each pixel. The more neighboring pixels used to determine pixel color, the more accurate the algorithm becomes, but it is also more computationally expensive. There are many methods in which one can interpolate the missing tile colors. These are described in more details in later sections.
Even without knowing how the algorithm operates, we can still qualify interpolation algorithms for specific performance metrics. Three important metrics for a wide variety of applications are sharpness, false color, and CPU usage/processing time.
The sharpness of an image is a function of the entire imaging system from lens to imager to interpolation performance. Assuming the latter two parts are optimized, interpolation tends to soften edges as most algorithms perform a form of averaging.
Related to sharpness, color artefacts also occur during interpolation, usually along edges, further compounding sharpness performance. Color artefacts occur because only a subsample of the true image color is captured by the camera and it is not possible in real time to interpolate an image without color artefacts.
Therefore, the right algorithm for the application should be based on desired sharpness, acceptable levels of false color, and desired performance (FPS, CPU load).
Sharpness
Practically, edges cannot transition from maximum digital count to minimum digital count in one pixel space. Edge detection algorithms are used to identify these transitions and detect edges. While using the right edge detection algorithm is crucial for machine vision applications, their performance is fundamentally limited by the captured image that must be processed.
This application note defines sharpness as the ratio between the maximum and minimum pixel intensity and the number of pixels taken to transition orthogonally from an edge line.

Where r represents the direction of the edge and nmax and nmin represent the orthogonal direction traversed to find the maximum and minimum pixel intensity θ.
The Siemens Star chart pattern is used to analyze sharpness. This chart is used to asses how well the algorithm can reconstruct edges at various angles as well as how well it can reconstruct edges in high frequency space.
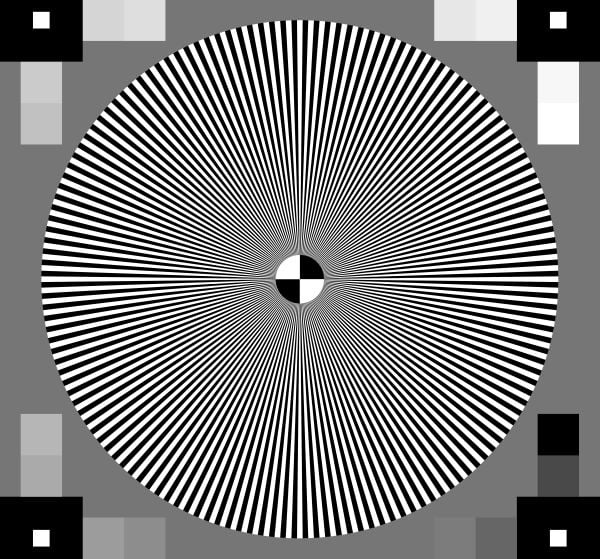
Siemens star chart
For edge detection, we used a Laplacian kernel to obtain adequate vertical and horizontal line detection. Now that the edge detection algorithm and sharpness are defined, the sharpness of each radial line rl as the total intensity gradient across the line can be written as:

The intensity in the orthogonal direction eventually plateaus for each r so this equation is valid as long as
θ(r,n + 1) - θ(r,n) > 0. Evaluating the entire image's sharpness for a given color interpolation method, we average across all possible line directions to help normalize the algorithms nominal performance.
The sharpness of the entire image is then defined as the average sharpness across all possible radial lines N.

A larger S means a larger gradient at edge boundaries, so a larger sharpness value means that on average the algorithm is better at preserving edges.
False color
Mean Square error is a method to measure false color, but it requires a reference image to be perfect and aligned. As this is not the most practical case, the method we used for this TAN is to convert the image to CIELAB color space and to measure the opponent color channels (a*,b*) of the image. This method separates out the color intensity from the actual perceived. Neutral color gray is represented as a*=0 and b*=0. Using this method we take advantage of the fact that the color image is grayscale to measure the amount of color added by interpolation by the following equation:

Where:
- C is the amount of false color,
- x,y are the CIELAB image coordinates along the cardinality ξ mapped by the sharpness, as we only want to consider edge cases since false color is generally a non-issue otherwise, and,
- a* and b* represent the opponent color channels in the image.
In this equation, a lower false color score C means the better the algorithm is at not introducing false colors during interpolation.
Available interpolation algorithms
There are several software interpolation algorithms available in Spinnaker and FlyCapture2. We compared the various interpolation algorithms you can use with our SDK and camera. Below is a list and comparison of the various interpolation algorithms.
The sharpness and false color pictures are snippets of what is available.
| Algorithm | Description | False Color | Advantages | Disadvantages |
|---|---|---|---|---|
| Nearest Neighbor | Uses adjacent pixels to interpret missing pixel colors |  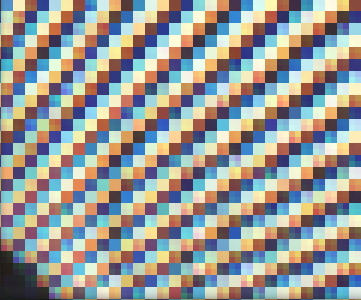 |
Very fast algorithm. Up to 16-bit pixel depth | Not accurate close to Nyquist frequency |
| Edge Sensing | Weighs surrounding pixels based on localized edge orientation |  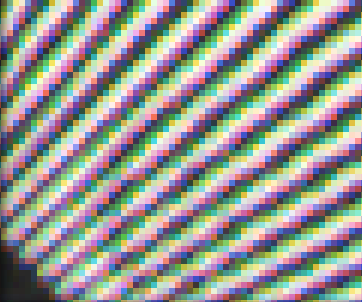 |
Creates sharper edges than Nearest neighbor, fast algorithm. Up to 16-bit pixel depth | Slower than nearest neighbor. Not very accurate close to Nyquist frequency |
| Rigorous | Computationally expensive. Deprecated by WDF and Directional |  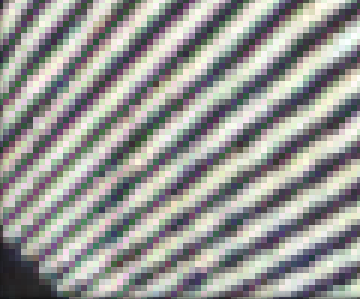 |
Not advised to use in new system designs | Not advised to use in new system designs |
| HQ Linear | Linear time algorithm based on assumptions image |  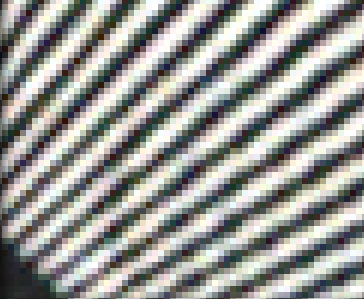 |
Fast algorithm with decent interpolation. Middle ground. Up to 16-bit pixel depth | Algorithm suffers at reconstructing vertical and horizontal lines and recognizing Color channel disparity. Performance best with “Gray” color images. |
| Directional | Follows image gradients |  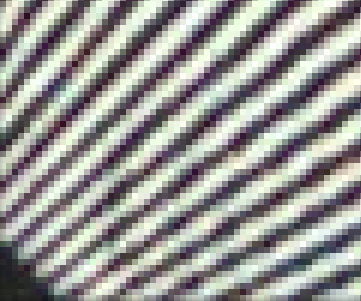 |
Accurate color and sharp. Up to 16-bit pixel depth. | Slow, suffers with noisy images |
| Weighted Directional Filter (WDF) | Similar to the Directional algorithm, but accounts for noise |  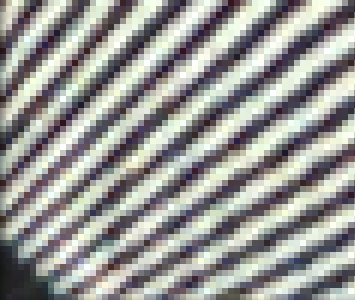 |
Accurate color, works well with noisy images. Up to 16-bit pixel depth | Slow |
In addition, we have two onboard color processing algorithms. One for IIDC-based cameras (ISP_IIDC) and one for GenICam-based cameras (ISP_GENI). Their performance is described below.
| Algorithm | Description | False Color | Advantages | Disadvantages | Camera Compatibility |
|---|---|---|---|---|---|
| ISP_IIDC | Similar to directional, but with fixed noise compensation |  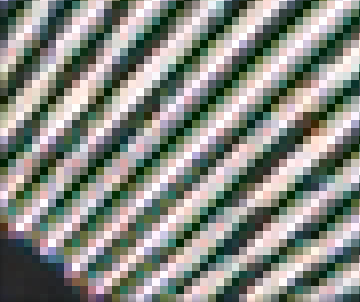 |
Does not use CPU | 8-bit pixel depth, may slow down frame rate of camera | Blackfly, Chameleon3, Flea3, Grasshopper3, Zebra2 |
| ISP_GENI | Similar to directional, but with adaptive noise compensation |   |
Does not use CPU | 8-bit pixel depth, may slow down frame rate of camera | Blackfly S, Oryx |
Overall, ISP_GENI outperforms ISP_IIDC in both sharpness and false color artefacts. Note the images are captured with the Sony IMX250 on the BFS-U3-51S5C and the GS3-U3-51S5C.
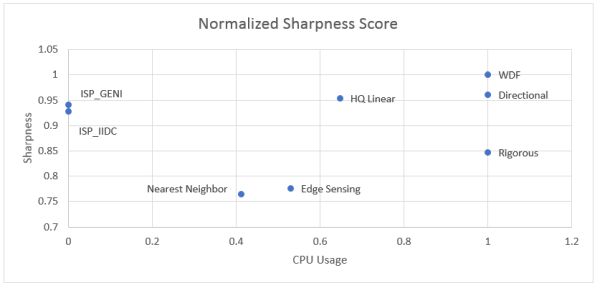
Comparison metrics: CPU intensity versus line sharpness
The chart below compares the various interpolation algorithms CPU intensity to edge score. ISP_IIDC and
ISP_GENI are onboard color processing so they do not affect the CPU load. Camera frame rate may decrease due to camera ISP, memory, or host interface bandwidth.
Comparison metrics: CPU intensity versus false color artefacts
The chart below compares CPU intensity with false color artefacts. As with the previous chart, ISP_IIDC and
ISP_GENI represent the onboard color processing.
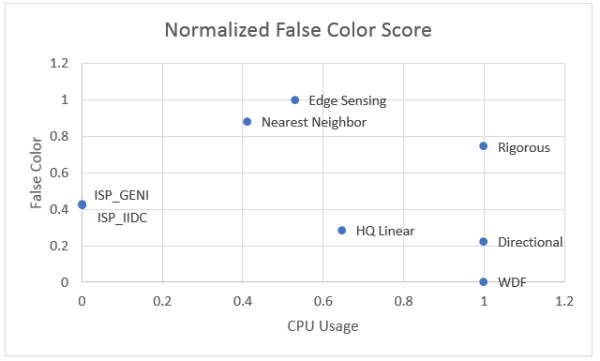
Note: HQ Linear works well for similar color gradients. When there are wide color variations in image scenes, the algorithm does not perform as well. The results you see for HQ linear in the graphs above are ideal use cases for HQ Linear, whereas ISP_GENI, ISP_IIDC, Directional, and WDF are more generic algorithms that perform approximately equally regardless of how the scene looks.
Commonly asked questions
Q) When do I need a color camera?
A) In most machine vision applications, color is not a necessity. Examples where color is important can be to ensure the correct color is printed on a label, to identify color encoded objects, and to determine the health of fruit or vegetation.
Q) What are the benefits of using software interpolation algorithms versus onboard interpolation algorithms?
A) Computationally, onboard interpolation occurs on the camera so the computer does not have to do any of the processing. However, this means that the camera may experience a frame rate hit, reducing the maximum frame rate it can achieve at a given configuration.
Onboard interpolation is limited to an 8-bit color depth, whereas color interpolation algorithms allow for 8-, 10-, 12-, or 16‑bit color, depending on the camera model.
Q) When should I be worried about what color interpolation algorithm to use?
A) For applications where you just need to evaluate a picture, it is unlikely you will see the finer details in what interpolation algorithm is used. However, in medical imaging, bar code recognition, 3D reconstruction, and many other fields where machines need to make calculations based on edge/volume sizes and the tolerance for error is low, optimizing color interpolation can be a key differentiator from competitors.
API calls to enable interpolation
Software interpolation method
In Spinnaker SDK (C++)
//Set to bayer (raw) pixel format
//Set to a RG color space if you want to enable onboard color processing
CEnumerationPtr ptrPixelformat= nodeMap.GetNode("PixelFormat");
CEnumEntryPtr ptrPixelformatRaw = ptrPixelformat
->GetEntryByName("BayerRG8");
ptrPixelformat ->SetIntValue(ptrPixelformatRaw ->GetValue());
//Select the correction conversion of the image, in this case: Edge Sensing
ImagePtr convertedImage = pImage->Convert(PixelFormat_RGB8, EDGE_SENSING);
In SpinView
- Open the SpinView application.
- Set the camera to output raw images: Under Image Format control
-->Pixel Format select a Bayer pixel format. - Set the interpolation method.
- Start streaming the camera.
- Right-click on the image in the streaming pane, from the menu select Color Procerssing Method, then select your desired method.
In FlyCapture2 SDK (C++)
//Set to raw image mode
//Set to a RGB color space if you want to enable onboard color processing
Fc2Format7ImageSettings imageConfig;
imageConfig.pixelFormat = FC2_PIXEL_FORMAT_RAW8;
//Select the correction conversion of the image, in this case: Edge Sensing.
Fc2setImageColorProcessing(*pImage, FC2_EDGE_SENSING);
In FlyCap2
- Open the FlyCap2 application.
- Select the camera and open the Camera Control dialog.
- Set the camera to output raw images. Under Custom Video Modes
-->Pixel Format select a Raw pixel format. - Select the interpolation method. Under Settings-->Color Processing Algorithm, select your desired method.
Onboard color interpolation (RGB or YUV)
In Spinnaker SDK (C++)
//Set to bayer (raw) pixel format.
//Set to a RG color space if you want to enable onboard color processing
CEnumerationPtr ptrPixelformat= nodeMap.GetNode("PixelFormat");
CEnumEntryPtr ptrPixelformatRaw = ptrPixelformat
->GetEntryByName("BGR8");
ptrPixelformat ->SetIntValue(ptrPixelformatRaw ->GetValue());
In SpinView
- Open the SpinView application.
- Set the camera to output raw images: Under Image Format Control
-->Pixel Format, select RGB, BGR, or YUV pixel format.
In FlyCapture2 SDK (C++)
//set to raw image mode
//set to a RGB color space if you want to enable onboard color processing
Fc2Format7ImageSettings imageConfig;
imageConfig.pixelFormat = FC2_PIXEL_FORMAT_BGR8;
//Select the correction conversion of the image, in this case: Edge Sensing.
Fc2setImageColorProcessing(*pImage, FC2_EDGE_SENSING);
In FlyCap2
- Open the FlyCap2 application.
- Select the camera and open the Camera Control dialog.
- Set the camera to output raw images. Under Custom Video Modes-->Pixel Format select a RGB, BGR, or YUV pixel format.


